scientific calculator
Graphing Calculator vs Scientific Calculator: Which One Do You Need
Compare a graphing calculator vs scientific calculator by features, classroom use, exams, and cost. Learn which tool fits algebra, calculus, and everyday math.
A graphing calculator vs scientific calculator decision comes down to one practical question: do you only need advanced functions, or do you also need to plot and analyze graphs? A scientific calculator handles trig, logs, exponents, and statistics on a numeric display. A graphing calculator adds a screen for functions, tables, and visual analysis. Students, teachers, and anyone choosing a school or exam device can use this guide to match features to real coursework—not marketing labels.
What Each Calculator Actually Does
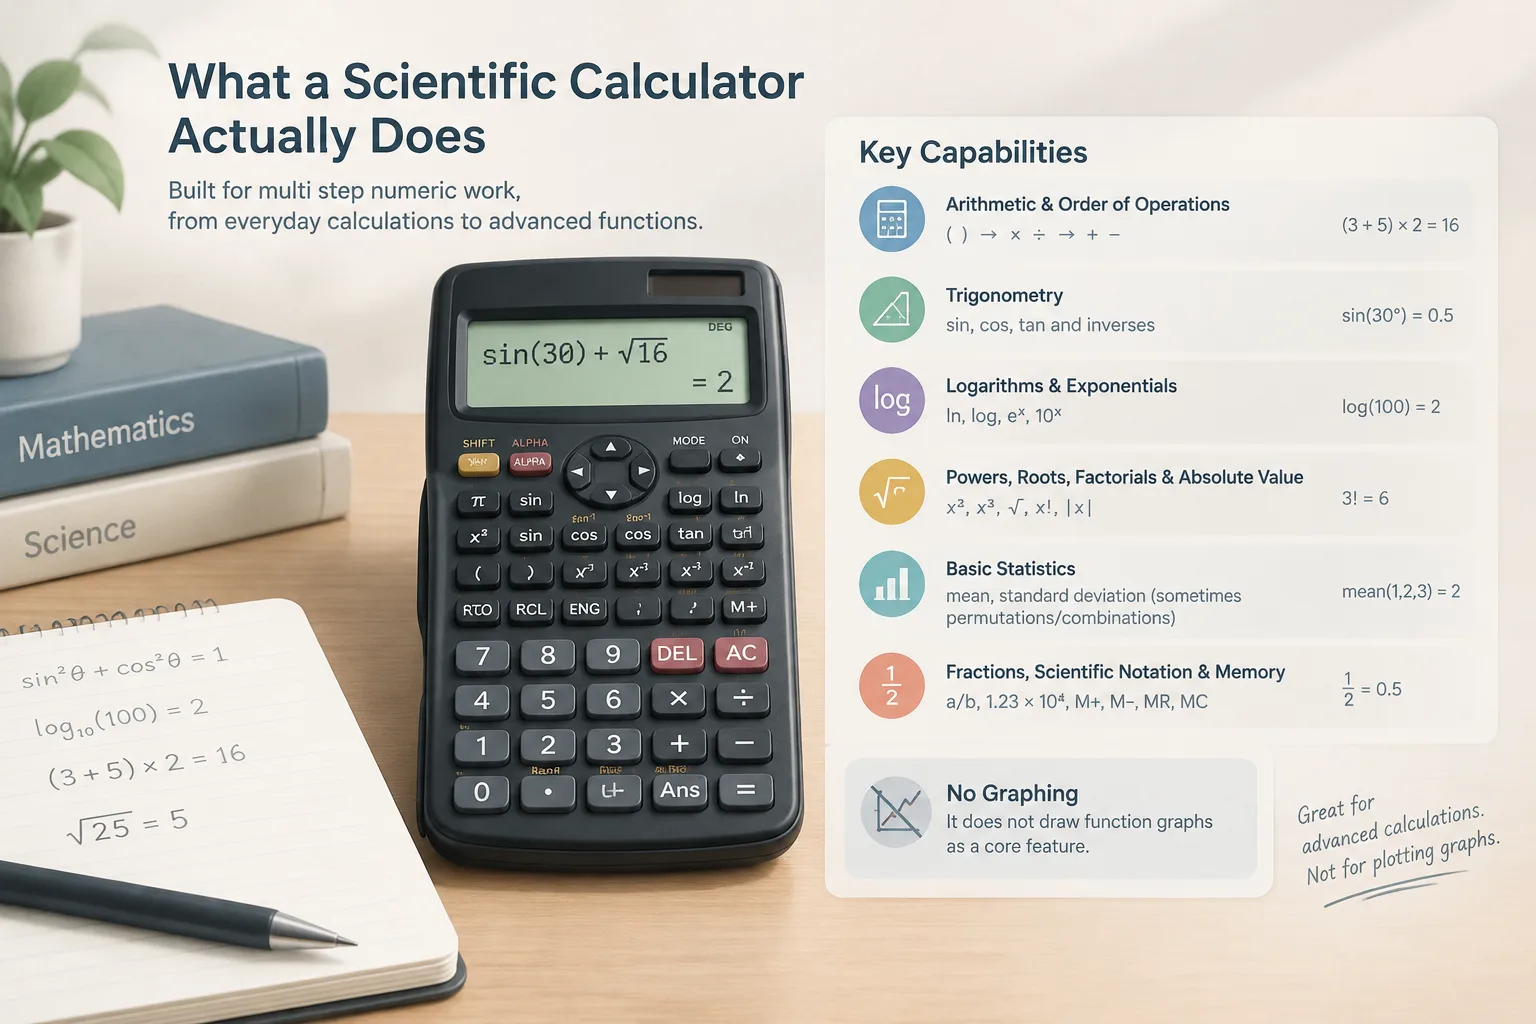
Scientific calculator in plain terms
A scientific calculator is built for multi-step numeric work. Typical capabilities include:
- Arithmetic with parentheses and order of operations
- Trigonometry (sin, cos, tan and inverses), often in degrees or radians
- Logarithms and exponentials (, , , )
- Powers, roots, factorials, and absolute value
- Basic statistics (mean, standard deviation) and sometimes permutations/combinations
- Fractions, scientific notation, and memory registers
It does not draw function graphs as a core feature. That is why people search for a non graphing scientific calculator when a class or exam bans graphing devices but still allows advanced functions.
Graphing calculator in plain terms
A graphing calculator includes scientific functions and adds a larger screen (or software UI) to:
- Plot one or more functions
- Zoom, trace points, and find intercepts or intersections
- Build value tables from expressions
- Run regression on data sets and display fitted curves
- In many models, handle matrices, parametric/polar graphs, and simple programming
The extra screen and CAS-like workflows (on some models) are why graphing units cost more and why some standardized tests restrict them.
Graphing Calculator vs Scientific Calculator: Feature Comparison
| Need | Scientific | Graphing |
|---|---|---|
| Algebra simplification by hand + numeric checks | Strong fit | Strong fit |
| Trig, logs, exponents | Yes | Yes |
| Plotting in class | No (or very limited) | Yes |
| Tables of values from a formula | Manual or limited | Built-in |
| Statistics with visual scatter/regression | Basic stats only on many models | Common |
| Exam policies that ban graphs | Often allowed | Often restricted |
| Price and learning curve | Usually lower / simpler | Higher / steeper |
| Everyday percent and finance-style arithmetic | Fine | Fine, but overkill |
Rule of thumb: if your syllabus never asks you to graph on the device, a scientific calculator is enough. If homework and tests expect on-device graphs, tables, or regression plots, you need graphing capability (hardware or an allowed app).
Core Math You Will Actually Compute
Both device types share the same underlying math. The difference is presentation: scientific tools return numbers; graphing tools can also show shapes of functions.
Order of operations (both types)
Expressions are evaluated with standard precedence: parentheses, exponents, multiplication/division, addition/subtraction.
Example expression:
Worked values: , then , then , then .
On a scientific keypad you enter the full expression carefully with parentheses. On a graphing unit you can store the expression and reuse it in a table or graph—same arithmetic, richer workflow.
Slope of a line (algebra checkpoint)
Example: points and :
A scientific calculator computes the fraction. A graphing calculator can also plot so you see the line.
Right-triangle trigonometry
Example: opposite , adjacent , hypotenuse :
Confirm mode is degrees vs radians before inverse trig—this is one of the most common student errors on either device.
Exponential growth (shared formula, different views)
Example: , , , :
Scientific: compute directly. Graphing: define and plot growth over time, which helps intuition but is not required for the numeric answer.
Quadratic roots (numeric vs visual)
Example: , , :
So or . Graphing units can show crossing the axis at those roots; scientific units still solve the formula if you enter it carefully.
How to Choose: A Practical Decision Path
Step 1 — Read the course and exam rules first
Before comparing brands or screens, check what is allowed:
- Middle school / basic algebra: scientific is usually enough
- Geometry / trig: scientific covers required functions
- Algebra II / precalculus with heavy graphing homework: graphing often expected
- AP Calculus, some engineering intro courses: graphing commonly used; confirm CAS rules
- Standardized tests: many allow scientific freely; graphing may be limited or model-restricted
If the policy says “scientific only” or “no graphing calculators,” buy or use a non graphing scientific calculator and practice on that form factor.
Step 2 — List the tasks you repeat weekly
Choose graphing if you regularly need to:
- Sketch during homework checks
- Compare two functions visually
- Build automatic tables
- Fit a line or curve to classroom data sets on-device
Stay scientific if you mainly:
- Evaluate expressions, trig, and logs
- Check arithmetic for algebra done on paper
- Compute combinations, factorials, or one-variable stats
- Work under time pressure with a simple keypad
Step 3 — Separate “need graphs” from “want a big screen”
A large display feels modern, but if your grade depends on paper graphing skills, a graphing calculator can become a crutch. Conversely, if the teacher demonstrates on a graphing model and assignments assume one, fighting with only a scientific device creates friction.
Step 4 — Consider software and browser tools
For home practice, a free online scientific tool can cover most numeric work without hardware. Try the scientific calculator on Calculator Lists for transparent function entry when you are checking homework steps. Use hardware that matches exam conditions when you practice timed tests.
Step 5 — Budget for longevity, not hype
Scientific units often last multiple courses. Graphing units make more sense when you will use graphs across several years (for example, through precalculus and calculus). Avoid buying graphing “just in case” if no course in your plan requires it.
Classroom Scenarios: What Fits Where
Best scientific calculator for school (when scientific is the right class of tool)
“Best” depends on allowed features and durability, not a single brand claim. For school use, a strong scientific choice usually offers:
- Clear multi-line or replay display so you can edit expressions
- Reliable degree/radian switching
- Fraction and decimal conversion
- Enough memory for multi-step problems
- Solar + battery or long battery life for all-day classes
That profile is ideal for general math, chemistry stoichiometry arithmetic, and intro stats without on-device plots.
When graphing becomes the better fit
Pick graphing when the learning goal includes interpreting shape: end behavior, intercepts, maxima/minima, and transformations like . Seeing parameter changes on a screen reinforces concepts that pure numeric output cannot show as quickly.
Teachers and parents
Align the device with the syllabus week one. A mismatch (graphing banned on exams but used all semester at home, or the reverse) causes avoidable stress. Keep a scientific backup even if the primary device is graphing—policies and battery failures both happen.
Common Misconceptions and Boundaries
“Graphing is always more advanced, so it is always better”
Not for every student. Extra menus slow some learners. If the course never grades graphing-on-device skills, complexity without benefit is a real downside.
“Scientific calculators cannot do ‘real’ math”
False. Scientific calculators handle the numeric core of high school and much college coursework. Graphing adds visualization and some data tools; it does not redefine algebra.
“Any calculator is fine for every exam”
Exam boards publish device rules. Some ban computer algebra systems, wireless features, or QWERTY keyboards. Always verify the current policy for your test date.
“Online tools replace exam hardware”
Browser calculators are excellent for learning and checking work—use them freely for practice—but timed exams usually require approved handhelds or locked environments. Practice the same way you will be tested.
Formula transparency matters more than the brand badge
Whether you tap a physical key or use an on-site tool, know what the calculator is computing. For percentages, ratios, and quick checks alongside classwork, the percentage calculator and triangle calculator can complement a scientific workflow when you want a second, transparent numeric check.
Quick Cost–Benefit Framing (No Product Picks)
Think in total cost of ownership:
- Scientific: lower purchase price, faster to learn, widely accepted, limited visualization
- Graphing: higher price, longer setup time, powerful for functions and data displays, more exam caveats
If two siblings share courses over several years and those courses require graphs, one graphing device may amortize well. If only one semester mentions graphs lightly, borrowing lab units or using teacher demos may be enough while you keep a personal scientific calculator.
Using an Online Scientific Calculator Effectively
When hardware is unavailable, follow a clean process:
- Write the symbolic problem on paper first.
- Convert to a single carefully parenthesized expression.
- Enter it in the scientific calculator.
- Compare the result with an estimate (order of magnitude check).
- Only then copy the value into homework, with units if required.
Example habit check: if you expect a sine ratio between 0 and 1 and the display shows 0.8 in degree mode vs a surprising value in radian mode, fix the mode before trusting the answer.
Summary: Which One Do You Need?
| Your situation | Lean toward |
|---|---|
| Arithmetic, algebra, trig, logs; exams ban graphs | Scientific |
| Required on-device plots, tables, regression visuals | Graphing |
| Unsure, early secondary school | Scientific first |
| Multi-year STEM track with graph-heavy courses | Graphing when the syllabus requires it |
| Home practice and transparent numeric checks | Online scientific tools + paper work |
A scientific calculator vs graphing calculator choice is a requirements match, not a status upgrade. Start from course rules and weekly tasks, then pick the simplest device that covers them. For day-to-day function entry and homework verification, open the free scientific calculator on Calculator Lists and keep your reasoning on paper—so the tool supports learning instead of hiding it.
FAQ
What is the main difference in a graphing calculator vs scientific calculator?
A scientific calculator focuses on numeric functions: trig, logs, powers, and basic stats. A graphing calculator includes those functions and adds a screen to plot functions, explore tables, and often run visual data analysis. The shared math is similar; the graphing unit adds visualization and workflow tools.
Is a non graphing scientific calculator enough for high school?
Often yes for courses that emphasize paper graphing and numeric evaluation. It is the standard choice when exams disallow graphing devices. If your algebra II or precalculus teacher requires on-device graphs for homework and tests, you will likely need graphing capability for that class.
What should I look for in the best scientific calculator for school?
Prioritize expression editing, clear degree/radian control, fraction support, durability, and exam acceptance—not novelty features. Match the allowed-function list from your school or test guide. Practice on the same type of device you will use under timed conditions.
Can I use a phone or online calculator instead of a graphing unit?
For learning and homework checks, online scientific tools are useful and transparent. For graded exams, phones and unrestricted apps are usually banned. Even when graphing software is allowed at home, confirm that exam rules accept the specific hardware or locked app your school names.
Do I need a graphing calculator for calculus?
Many calculus students use graphing calculators to inspect functions, but success still depends on understanding limits, derivatives, and integrals analytically. Check your course and AP or college exam calculator policy: some topics allow graphing support; others restrict CAS features. A scientific calculator remains valuable for fast numeric work even if you also own a graphing model.
Looking for more tools?
Try our free Free Calculators