Rent vs Buy Calculator

Home purchase
Ownership costs & horizon
Renting alternative
Rent vs Buy Results
The form is pre-filled with example values - modify them and click Calculate to see your results.
Verdict
Net cost comparison over your ownership horizon
Net cost comparison
Rent vs Buy Calculator
How this was computed
- Net equity at sale
- $173,101
- Renter investment portfolio
- $243,490
- Formula used
- Buy net cost = down payment + closing + Σ(P&I + tax + insurance + HOA + maintenance) − net sale proceeds
- Explanation
- Renting wins over 7 years by about $108,000. Buying costs $160,199 net vs renting $52,199 net.
- Calculation steps
- Loan amount: $400,000 − 20% down = $320,000,Monthly P&I: $2,023; plus tax, insurance, HOA, maintenance → $2,873/month,Home value after 7 yrs at 3%: $491,950,Net sale proceeds after loan payoff and 6% selling costs: $173,101,Buyer net cost: $92,000 upfront + $241,300 payments − $173,101 equity = $160,199,Renter net cost: $203,689 rent − $151,490 investment growth = $52,199
Rent vs Buy Calculator: How to Decide What Is Right for You
Use a rent vs buy calculator to compare the long-term cost of renting versus buying a home. See the formulas, inputs, examples, and limits so you can run a clearer rent vs buy decision.
Rent vs Buy Calculator: How to Decide What Is Right for You
A rent vs buy calculator compares the long-term financial picture of renting a home versus buying one. It estimates total costs, equity buildup, and opportunity cost so you can frame a clearer rent vs buy decision with your own numbers—not generic rules of thumb.
What a rent vs buy calculator actually measures
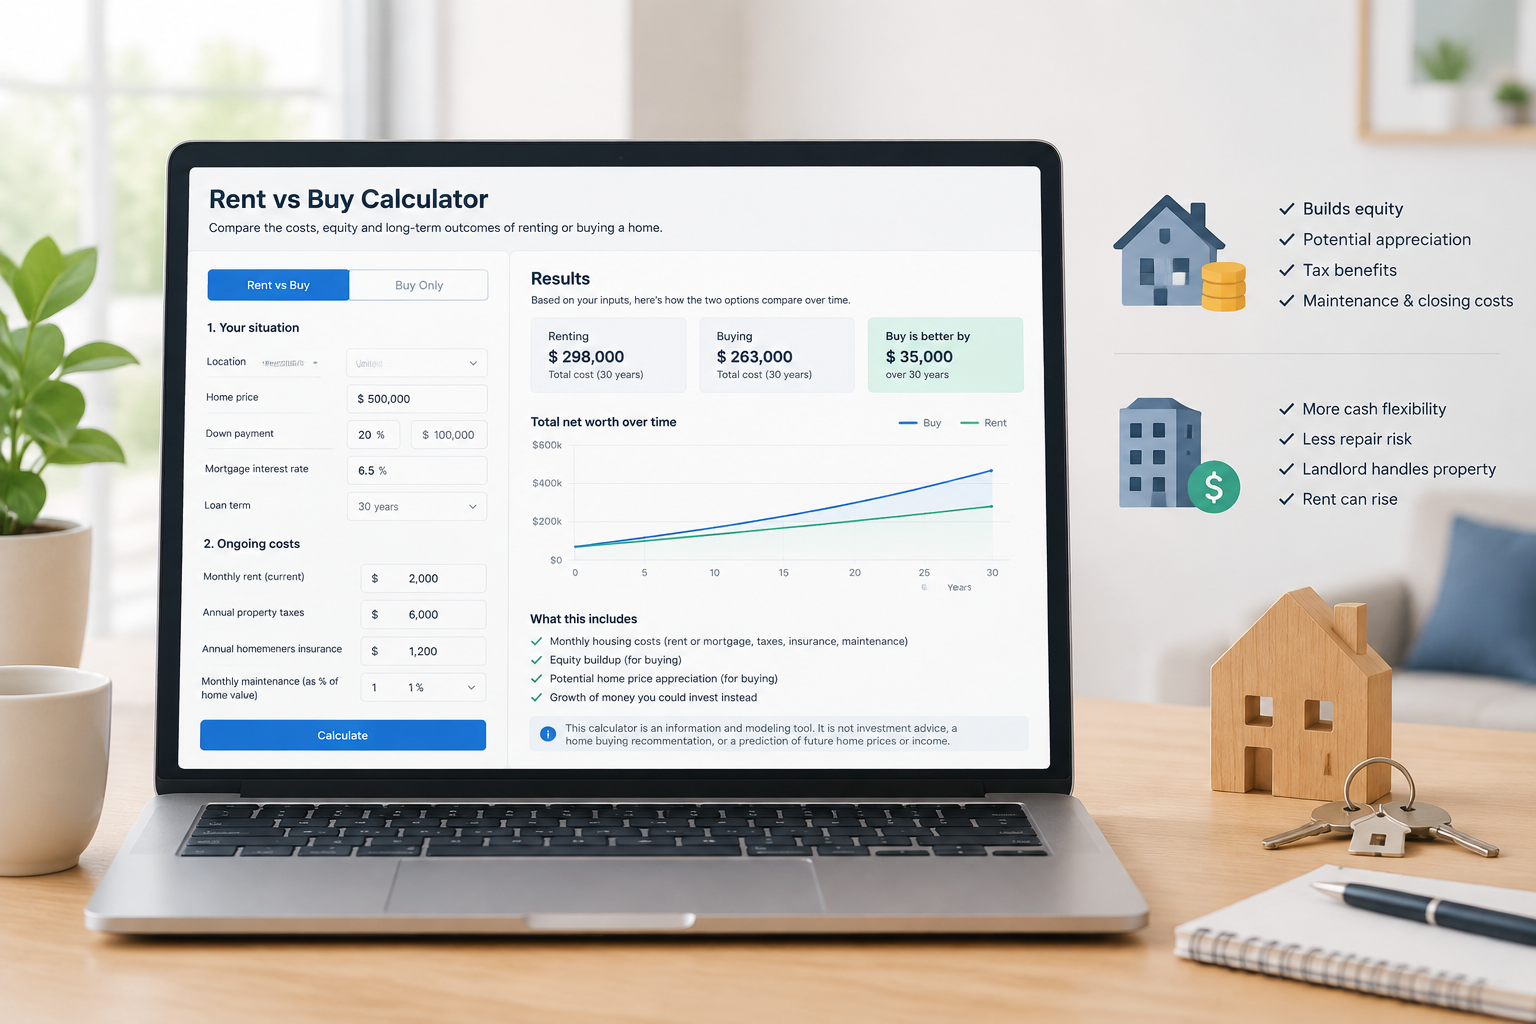
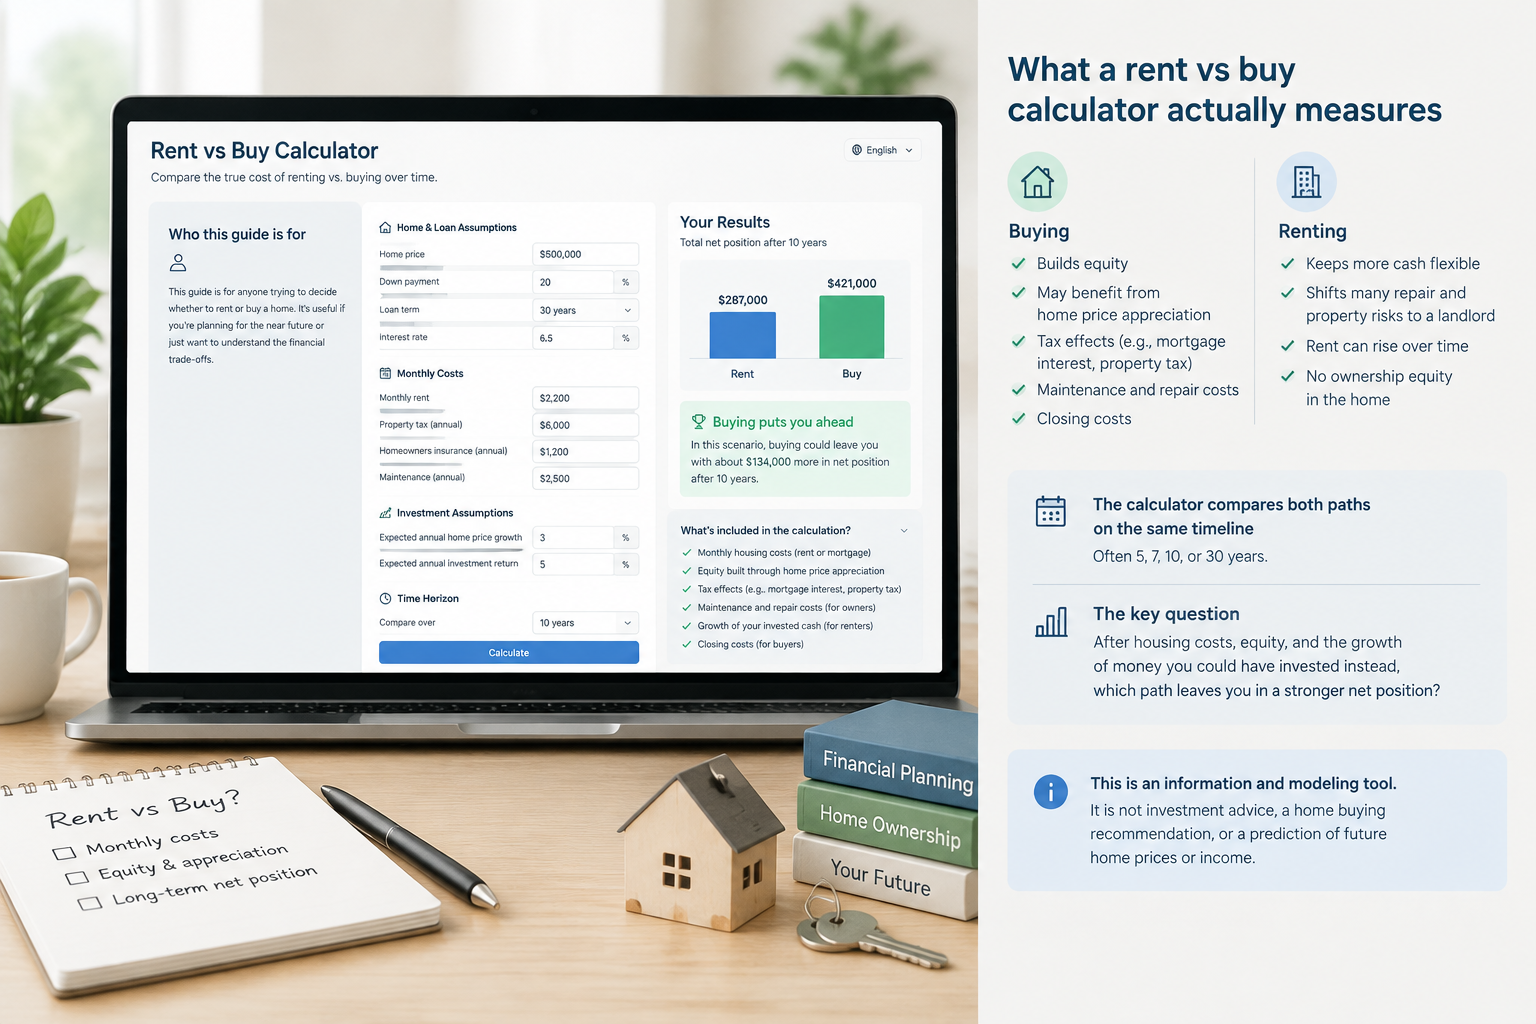
Renting and buying are not only different monthly payments. Buying builds equity and may involve appreciation, tax effects, maintenance, and closing costs. Renting keeps more cash flexible and shifts many repair and property risks to a landlord, but rent can rise and you do not build ownership equity in the home.
A practical calculator tries to put both paths on a similar timeline—often 5, 7, 10, or 30 years—and ask: After housing costs, equity, and the growth of money you could have invested instead, which path leaves you in a stronger net position?
This is an information and modeling tool. It is not investment advice, a home-buying recommendation, or a prediction of future home prices or interest rates.
Who this guide is for
- Renters weighing whether to buy in the next few years
- Buyers comparing a specific purchase price and mortgage against continued rent
- Anyone who wants transparent math behind renting vs buying a house instead of a single “rule” like “buy if you stay 5 years”
Core ideas behind the rent vs buy decision
Total cost of renting
Over a chosen horizon, renting cost usually includes:
- Monthly rent (with assumed annual increases)
- Renter’s insurance
- Utilities you pay as a tenant (if you want an apples-to-apples comparison)
- Opportunity cost of any large deposits only if they meaningfully lock up cash (often small relative to a down payment)
Rent does not build home equity. Cash not used for a down payment can, in a model, be treated as investable.
Total cost of buying
Buying cost usually includes:
- Down payment and closing costs
- Mortgage principal and interest
- Property taxes
- Homeowners insurance
- HOA fees (if any)
- Maintenance and repairs (often modeled as a percent of home value per year)
- Possible private mortgage insurance (PMI) when the down payment is low
Against those costs, ownership may produce:
- Principal paydown (equity from the loan amortizing)
- Home price changes (appreciation or depreciation—an assumption, not a forecast)
- Remaining home equity at the end of the period, minus selling costs if you model an exit
Opportunity cost
Money tied up in a down payment and extra ownership cash outflows could otherwise earn a return elsewhere. A transparent model often assumes an after-tax investment return rate on that capital. Likewise, if buying’s monthly outflow is higher or lower than rent, the difference can be modeled as invested or borrowed from investment capacity.
Formulas used in a transparent rent vs buy calculator
Exact implementations vary, but a clear model usually combines these building blocks. Assumptions should always be visible so you can re-run the math.
1) Mortgage payment (fixed-rate, standard amortization)
For a loan amount , monthly rate , and months:
Where is the principal-and-interest payment.
2) Remaining loan balance after months
Equity from principal paydown ≈ the home value on the appreciation path minus (adjusted for selling costs if you exit).
3) Future home value (simple appreciation assumption)
If annual appreciation rate is for years:
This is a modeling input. Real markets move irregularly; the calculator does not “know” future prices.
4) Cumulative rent with annual increases
If year-1 annual rent is and rent grows at rate :
Total rent over years ≈ (or a monthly equivalent).
5) Net position style comparison (conceptual)
A common comparison at year :
Buy net worth effect (simplified)
Ending home equity after selling costs − cumulative ownership cash spent + value of any side investments funded by buy-vs-rent cash-flow differences
Rent net worth effect (simplified)
Value of investments funded by avoiding a down payment and by monthly cash-flow differences − cumulative rent and renter costs
The calculator then contrasts those net positions (or total effective costs). Different tools arrange the algebra slightly differently; what matters is that every cash flow and every assumed return is explicit.
Worked example with round numbers
Suppose:
- Home price: $400,000
- Down payment: 20% = $80,000
- Loan: $320,000 at 6% annual, 30 years
- Monthly P&I: about $1,919
- Rent alternative: $2,200 per month
- Rent growth: 3% per year
- Property tax + insurance + maintenance: $700 per month combined (illustrative)
- Expected holding period: 7 years
- Home appreciation assumption: 2% per year
- Investment return assumption on cash not used to buy: 5% per year
- Selling costs at exit: 6% of sale price
Buy path (illustrative):
Monthly housing outflow ≈ $1,919 + $700 = $2,619 (before any tax effects).
After 7 years, remaining balance on the amortizing loan is lower than $320,000; equity includes paydown plus any price change. Sale proceeds after 6% costs are reduced accordingly. The $80,000 down payment was not invested in the market in this path.
Rent path (illustrative):
Rent starts at $2,200 and rises about 3% annually. The $80,000 stays invested in the model at 5%. Monthly savings or shortfalls versus the buy outflow are also invested or drawn in the model.
How to read the result:
If the rent path’s invested nest egg exceeds the buy path’s net equity after costs (under your assumptions), renting “wins” on that scenario. If buy equity and cash-flow effects dominate, buying “wins” on that scenario. Change appreciation, rate, rent growth, or years stayed, and the winner can flip. That sensitivity is the point of the tool.
Use the free rent vs buy calculator to plug in your price, rate, rent, fees, and horizon instead of relying on this sketch.
How to use the Calculator Lists rent vs buy calculator
- Enter the purchase side: price, down payment, interest rate, loan term, taxes, insurance, HOA, maintenance rate, and closing costs if available.
- Enter the rent side: current rent and expected annual rent increase.
- Set the time horizon: how many years you might stay before selling or before you want the comparison to end.
- Set growth and return assumptions: home appreciation and the return you might earn on money not put into the house. Keep them conservative and consistent.
- Review the comparison output: total costs, implied equity, and which path looks stronger under those inputs.
- Stress-test: raise the mortgage rate, lower appreciation to 0%, increase maintenance, or shorten the stay. A decision that only works in one optimistic case is fragile.
Related tools that often pair with this analysis
- Estimate loan payments with a mortgage calculator
- See principal paydown over time with an amortization calculator
- Check payment sizing against income using a house affordability style workflow
- Model cash growth assumptions with a compound interest calculator
Common mistakes and boundaries
Mistakes that distort renting vs buying a house
- Comparing rent only to the mortgage P&I. Taxes, insurance, maintenance, HOA, and closing costs are real ownership costs.
- Ignoring selling costs and move-out friction. Commissions and closing costs on a sale can erase early equity.
- Assuming high appreciation by default. Appreciation is uncertain; run flat and low cases.
- Forgetting opportunity cost on the down payment. Large cash tied up in the home is not free.
- Using a horizon shorter than your realistic stay. Short stays often favor renting once transaction costs are included; long stays can favor buying—but only if cash flow and risk still fit.
- Treating tax benefits as automatic and identical for everyone. Deductibility and caps depend on jurisdiction and personal tax situation; if you include taxes, use assumptions you understand or keep them off for a cleaner base case.
- Confusing “calculator says buy” with “you should buy.” Credit, job stability, emergency reserves, local market liquidity, and personal preference matter and are outside a pure cost model.
What this model does not do
- It does not predict markets, rates, or rents.
- It does not guarantee a better financial outcome.
- It does not replace a lender pre-approval, inspection, or professional tax or financial advice.
- It does not score lifestyle value (stability, customization, mobility) in money terms unless you add those judgments yourself.
Practical checklist before you trust the output
- Are maintenance and insurance realistic for the property type and location?
- Is the down payment cash truly available without draining emergency savings?
- Do you have a buffer for repairs in year one of ownership?
- Have you compared at least three horizons (for example 3, 7, and 15 years)?
- Have you varied appreciation and investment return by a few percentage points either way?
When the buy advantage only appears under aggressive appreciation and a long stay, treat that as a narrow scenario—not a universal answer.
FAQ
How does a rent vs buy calculator work?
It totals the expected costs of renting and buying over a period you choose, then accounts for mortgage paydown, optional home value change, selling costs, and the growth of money you could invest if you did not buy. The result is a side-by-side net comparison under your assumptions.
Is renting vs buying a house only about which monthly payment is lower?
No. A lower mortgage payment can still mean higher total ownership cost after taxes, insurance, and maintenance. Renting may look cheaper monthly but build no home equity. The calculator’s job is to compare full paths, not a single month.
What inputs matter most in a rent vs buy decision?
Usually: length of stay, down payment size, mortgage rate, rent level and rent growth, maintenance, closing and selling costs, and the return assumed on cash not used to buy. Small changes in stay length and appreciation often swing results more than people expect.
How many years should I enter into the calculator?
Use a horizon that matches how long you might realistically keep the home before selling or major life changes. Run shorter and longer cases. Many transaction costs make very short ownership periods harder for buying to “win” on pure math.
Can I use this tool as financial or home-buying advice?
No. Calculator Lists provides free, transparent calculation helpers for education and planning math. Your results depend on assumptions you enter. For personal decisions, consider qualified local professionals and your full financial situation.
Run your own numbers
Rules of thumb skip your rate, rent, fees, and timeline. A structured comparison does not. Open the rent vs buy calculator on Calculator Lists, enter realistic figures, stress-test the assumptions, and use the output as one clear input to your housing plan—alongside budget, reserves, and how long you expect to stay.